Our reporting services are a valuable asset to the community, offering practical insights and tools for data-driven decision-making. Our reports provide a comprehensive overview of chatbot interactions, shedding light on the frequency of engagements. Each report will be readily downloadable in various formats.
This article will review the following reports:
Review Report
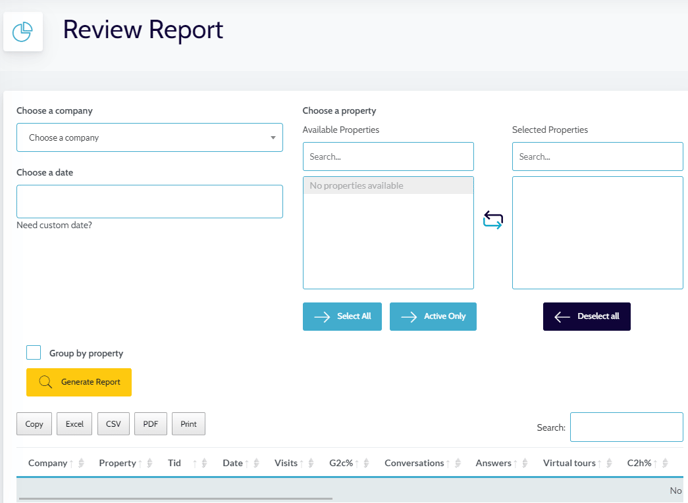
The Review Report is our most popular report, providing insights into the effectiveness of marketing strategies and audience behavior. It helps measure performance by tracking various aspects, such as interactions, conversations, responses, leads, and appointments on the chatbot.
- In the Dashboard, in the left-hand menu select REPORTS --> REVIEW REPORTS
- Select the company, date(s), and property(s) that you would like to include, and simply click on the "Generate Report" to view the data.
- At the bottom of this report, there is a legend with all the information that is on the report.
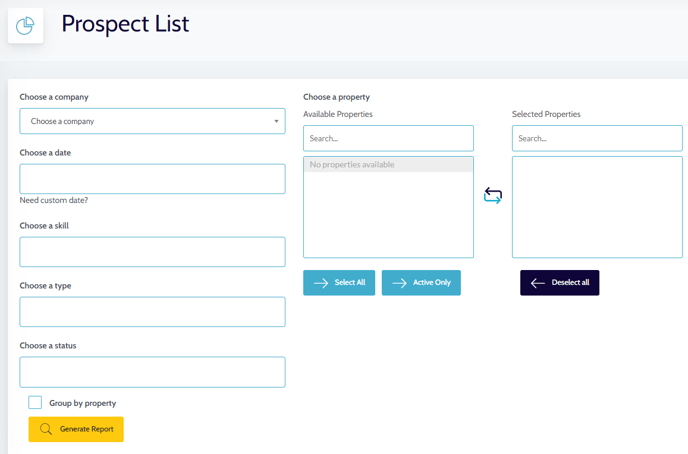
Prospect List
- The Prospect List Report is the perfect place to find all the prospects that have been generated through the bot. To run this report, filter by company, date, skill (chat or nurture), communication type, and status.
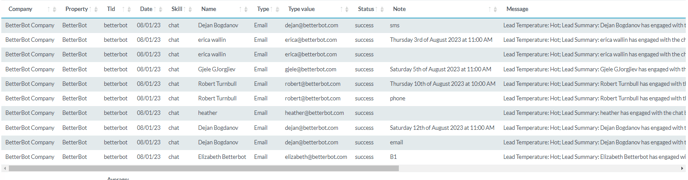
- After selecting the information, the results will be conveniently displayed below. This will provide all the necessary details about the prospects, including their names, the type of contact they left, their contact information, any notes, the message they left, and the date it was generated.
UTM (Urchin Tracking Module)
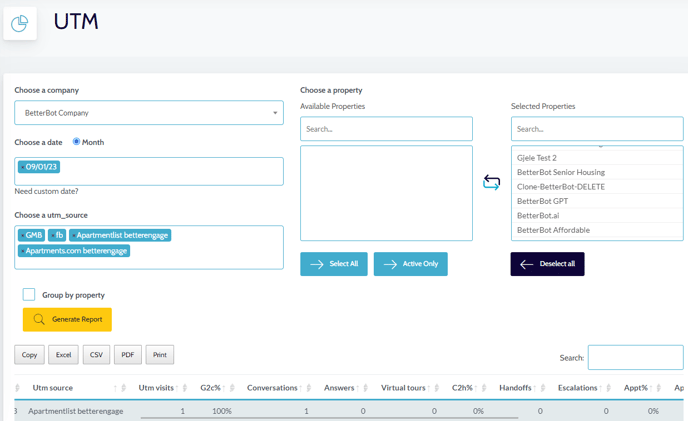
- If a user comes from a UTM source (such as Facebook) and engages with the bot, we track the greetings, conversations, leads, and appointments they make. In the UTM report, you can review the user's source (listed under the UTM Source column) and their actions on the bot.
- To generate the report, simply select the desired company, date, utm_source, and properties. Once these selections have been made, the data will be conveniently displayed below.
- Property Name - Name of the property for which the report is run
- UTM Source - Unique UTM source tracked.
- Integration Key - The unique integration key for the bot integration, if any.
- UTM Grt - Total greetings the bot had with prospective renters tracked with a UTM code
- G2C% - UTM Grt. vs. Tot. Grt.
- UTM Conv - Total conversations the bot had with prospect tracked with a UTM code
- C2H% - UTM Conv. vs. Tot. Conv.
- UTM Handoffs - Total Handoffs generated tracked with a UTM code
- H2A% - UTM Handoffs vs. Tot. Handoffs
- UTM Appointments - Total number of appointments scheduled with a UTM code
- In-Person - In-Person appointments scheduled
- Phone - Phone appointments scheduled
- Self - Self-Guided appointments scheduled
- Live - Live-video appointments scheduled
Data Marketing
- The Data Marketing report is used to track the impact of online marketing efforts. For instance, Data Marketing allows us to discover interactions, the total number of conversations (business hours, after hours), greetings, leads, visits, clicks on each intent on the bot, and more.
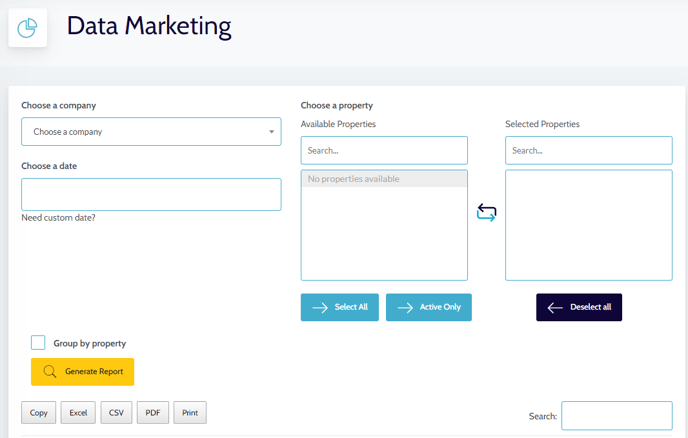
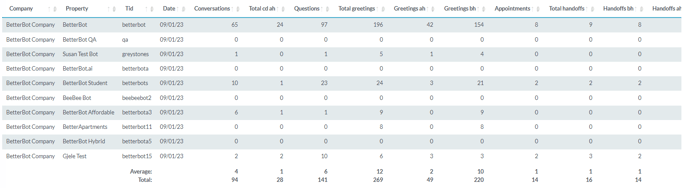
Columns explanation:
- Property- Name of the property for which the report is run
- Total # Conversations- Total number of Conversations the bot had with prospective renters.
- Total # CD-AH- Total number of Conversations the bot had with prospective renters after business hours.
- Total # of Questions Asked- Total number of Questions Asked
- Total # Greetings- Total number of greetings the bot had with prospective renters.
- Total # Greetings AH- Total number of greetings the bot had with prospective renters after business hours
- Total # Greetings BH- Total number of greetings the bot had with prospective renters on business hours
- Total # of Appointments- Total number of appointments scheduled
- Total # of Handoffs- Total number of Handoffs generated
- Total # Handoffs BH- Total number of Handoffs generated on business hours
- Total # Handoffs AH- Total number of Handoffs generated after business hours
- # CD-BH (Monday)- Number of conversations on business hours per day (Monday)
- # CD-AH (Monday)- Number of conversations after business hours per day (Monday)
- # CD-BH (Tuesday)- Number of conversations on business hours per day (Tuesday)
- # CD-AH (Tuesday)- Number of conversations after business hours per day (Tuesday)
- # CD-BH (Wednesday)- Number of conversations on business hours per day (Wednesday)
- # CD-AH (Wednesday)- Number of conversations after business hours per day (Wednesday)
- # CD-BH (Thursday)- Number of conversations on business hours per day (Thursday)
- # CD-AH (Thursday)- Number of conversations after business hours per day (Thursday)
- # CD-BH (Friday)- Number of conversations on business hours per day (Friday)
- # CD-AH (Friday)- Number of conversations after business hours per day (Friday)
- # CD-BH (Saturday)- Number of conversations on business hours per day (Saturday)
- # CD-AH (Saturday)- Number of conversations after business hours per day (Saturday)
- # CD-BH (Sunday)- Number of conversations on business hours per day (Sunday)
- # CD-AH (Sunday)- Number of conversations after business hours per day (Sunday)
- Find a Home- Find a home interactions with percentage
- Contact Me- Contact Me interactions with percentage
- Specials- Specials interactions with percentage
- Schedule Appointment- Schedule Appointment interactions with percentage
- 3D Tour- 3D Tour interactions with percentage
- Photos- Photos interactions with percentage
- Amenities- Amenities interactions with percentage
- Neighborhood- Neighborhood interactions with percentage
- Current Resident- Current Resident interactions with percentage
- Espanol- Espanol interactions with percentage
- AVG Conv per day- Average conversations per day
- AVG Conv per week- Average conversations per week
- AVG Conv per month- Average conversations per day month
- AVG App per day- Average appointments per day
- AVG App per week-Average appointments per week
- AVG App per month- Average appointments per month